Most ecommerce dashboards look impressive but do very little.
They show a lot of numbers, yet teams still struggle to decide what to do next.
A good dashboard is not about tracking everything.
It is about helping you make better decisions, faster.
This guide explains how to build an ecommerce analytics dashboard that actually supports growth.
Why most ecommerce dashboards fail
Many ecommerce dashboards fail for simple reasons.
• Too many metrics
• No clear focus on goals
• Numbers shown without context
• Dashboards built for monitoring, not decisions
When everything feels important, nothing is clear.
Start with decisions, not metrics
Before building any dashboard, answer one question.
What decisions should this dashboard help you make?
For most ecommerce brands, common decisions include:
• Where to increase or reduce ad spend
• Which products to push or pause
• Whether growth is profitable
• Where customers drop off
Metrics should only exist if they support a decision.
Choose metrics that actually matter
Instead of tracking everything, focus on a small set of core metrics.
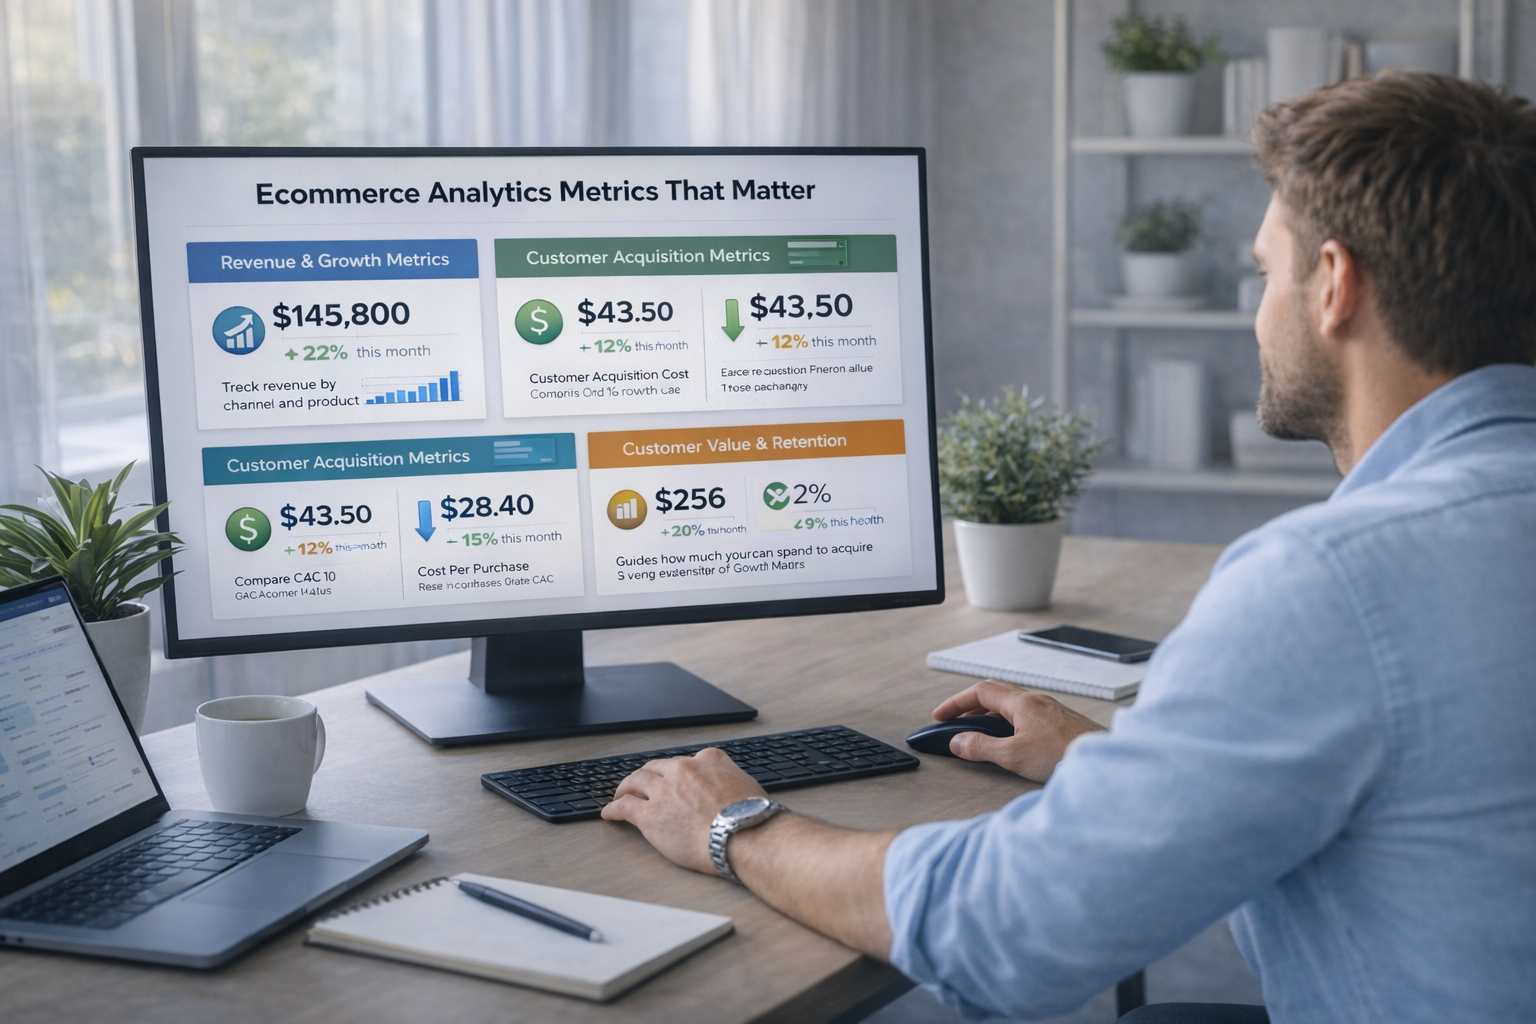
Common high value ecommerce metrics
• Revenue
• Conversion rate
• Average order value
• Customer acquisition cost
• Contribution margin
• Repeat purchase rate
These metrics tell you if growth is healthy, not just growing.
Group metrics by purpose
A strong dashboard is structured, not crowded.
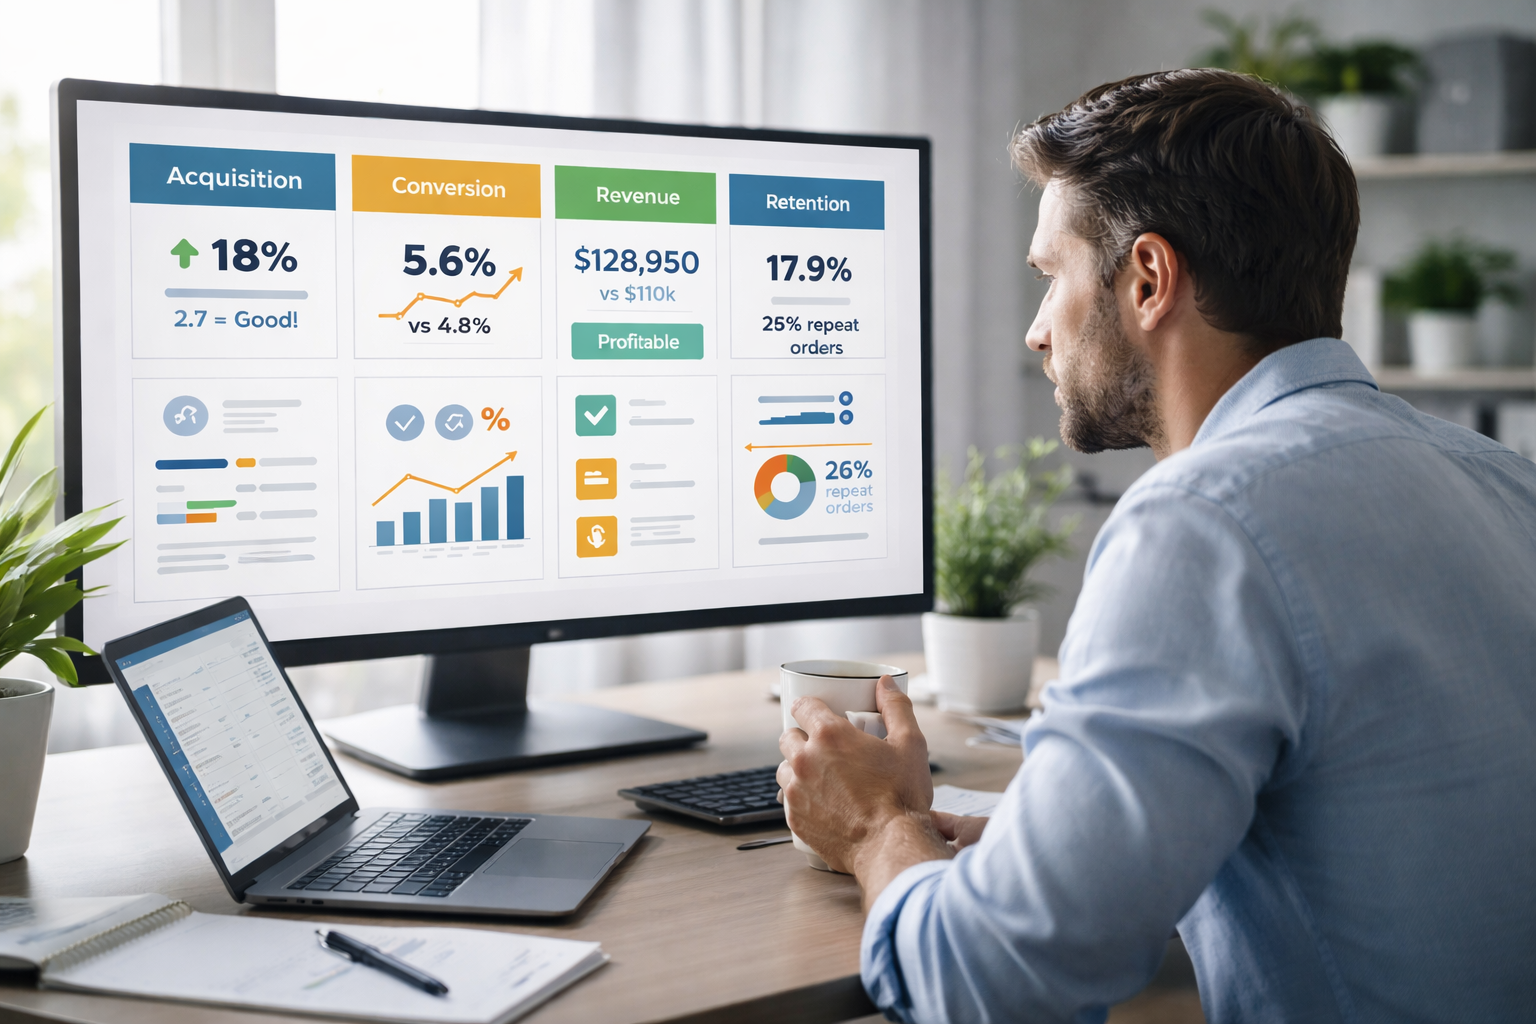
Organize metrics into clear sections such as:
• Acquisition performance
• On site conversion
• Revenue and profitability
• Retention and repeat behavior
This helps teams quickly understand where problems or opportunities exist.
Add context, not just numbers
Numbers alone do not drive decisions.
Every important metric should answer at least one of these:
• Is this good or bad
• Why did it change
• What should we do next
Simple comparisons like month over month or target vs actual add instant clarity.
Keep the dashboard simple and readable
A dashboard should be easy to scan in under two minutes.
• Avoid clutter
• Use clear labels
• Limit charts per section
• Highlight what needs attention
If someone needs a call to understand the dashboard, it is too complex.
Separate dashboards from deep analysis
Dashboards are not meant for exploration.
Use dashboards to:
• Monitor performance
• Spot issues quickly
• Align teams on priorities
Use separate analysis when you need to dive deeper into data.
Trying to do both in one place usually fails.
Review and improve regularly
A dashboard is not a one time project.
As your business changes, your dashboard should evolve.
• Remove metrics that are no longer useful
• Add metrics when decisions change
• Simplify whenever possible
The best dashboards improve over time.
Final thoughts
An ecommerce analytics dashboard should not impress.
It should guide.
When built correctly, a dashboard helps you:
• See problems early
• Focus on what matters
• Make confident decisions
• Grow without guesswork
Clarity, not complexity, is what turns data into growth.